Esri Story Maps founder weaves a narrative of mapmaking, design, and nature
Only two weeks before the 100th anniversary of the sinking of the Titanic on April 14, 1912, a development team at Esri, the world’s leading geospatial mapping software, decided to test out their new storytelling-template tool.
“We said, ‘Let’s do something on the Titanic. What can we do in a short period of time?’ And one of my colleagues discovered that Wikipedia had the whole passenger manifest,” esteemed cartographer Allen Carroll, the Esri team’s founder and lead, recalled in a recent talk at Clark University. “It listed every person, every name, what class they were on the ship, and their origin and destination.”
Their tool — which would later be expanded into the widely used Esri ArcGIS StoryMaps — illuminated the deep class lines that helped determine the fates of the Titanic’s passengers.
Released on April 14, 2012, “Geography, Class, and Fate: Passengers on the Titanic” revealed, visually and dynamically, that more than half of the wealthier first-class passengers, most of whom came from large cities in the U.S. and Europe, survived, according to Carroll. Meanwhile, three-quarters of the steerage passengers — from small villages in Ireland, Scandinavia, and elsewhere — perished.
One of the team’s first such experiments, the Titanic story map, “went viral” once launched on the Esri website, Carroll said. “Here was this really powerful pattern that was hidden in a table that we didn’t realize was there until we created a map.”
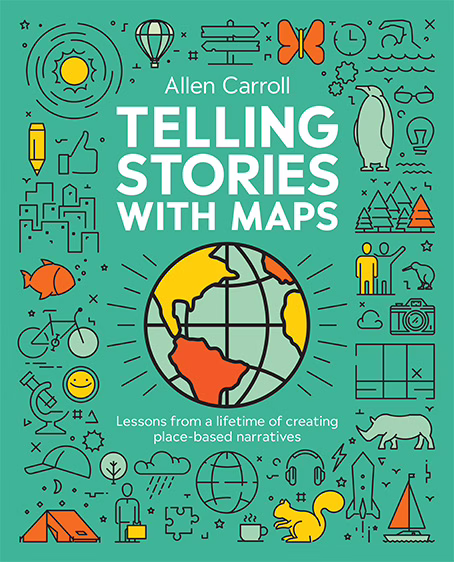
Through a series of maps that he presented during his Oct. 10 talk in Higgins Lounge, Carroll told his personal and professional story, which aligned with an overview of modern cartography and dynamic, visual storytelling. Author of the 2025 book “Telling Stories with Maps: Lessons from a Lifetime of Creating Place-Based Narratives” (Esri Press), Carroll has had a long career spanning both print and multimedia publishing, starting with his job as editor of the alumni magazine at Connecticut College, from which he graduated in 1973.
“Why do stories and maps matter?” he asked his Clark audience. “Storytelling is one of the basic things that make us human. And it’s really the original social media.” Maps, he added, “can play a part in the story. They can play bit parts, like the locator maps, or they can be stars of the show. They can also be supporting players along with other multimedia content.”
Over 27 years, Carroll served as art director of National Geographic Magazine and chief cartographer for National Geographic Maps, including overseeing the “Historical Atlas of the United States,” which marked the National Geographic Society’s centennial anniversary in 1988. He also was the publisher’s main liaison with Esri, working to digitize the National Geographic Society’s cartographic data. While working together to produce the seventh edition of the “Atlas of the World,” they launched the accompanying digital National Geographic Map Machine in 1999.
“It was our first interactive, thematic atlas on the web, and the Associated Press picked up the story, and all of a sudden there was a huge amount of traffic,” Carroll recalled.
The popularity of the web-based map led Carroll to consider how he might combine two of National Geographic’s best-known assets: beautiful maps and stunning photography. “Couldn’t we combine those things with text to tell stories in an interactive way and perhaps even make that capability available to anybody and everybody?” he wondered.
In 2010, Carroll answered that question when he joined Esri, with which he had partnered and already knew founder and CEO Jack Dangermond. Given a “vague mandate” and creative freedom, Carroll led the team to develop and launch the Story Map tool in 2012, showing off its capabilities by creating not only the Titanicmap but a “Zoo Babies” story map in 2014, along with many others.
Those projects laid the groundwork for the launch, in 2019, of the ArcGIS StoryMaps platform, which has been used by professionals at organizations, governments, and universities to create more than 3 million story maps, according to Esri. Faculty and students in Clark’s School of Climate, Environment, and Society regularly use StoryMpas in their research and classroom projects. (Check out the public gallery of ArcGIS StoryMaps.) The so-called Classic Story Maps, which Esri debuted in 2012, will be retired next year.
“Storytelling is one of the basic things that make us human. And it’s really the original social media.”
— allen carroll, founder of esri story maps
Carroll first became enamored with maps in childhood, when “staring” at a world map on the wall above his bunkbed and “trying to push Africa and South America together in my mind,” he recalled. “That might have resulted in some early neurological connections forming that would bear fruit later.”
He developed a love of the natural world and discovered a passion for birds and birding during high school. Carroll later pursued a bachelor’s degree in human ecology from Connecticut College, where he drew his first map, that of the college’s arboretum. In the late 1970s, he honed his skills in design and illustration as editor of his alma mater’s alumni magazine.
“I was able to assign myself illustrations for the alumni magazine that allowed me to accumulate a portfolio, which I then took with me to Washington, D.C., where I did a bunch of covers for The New Republic magazine, The Washington Post, and other publications,” he recalled.
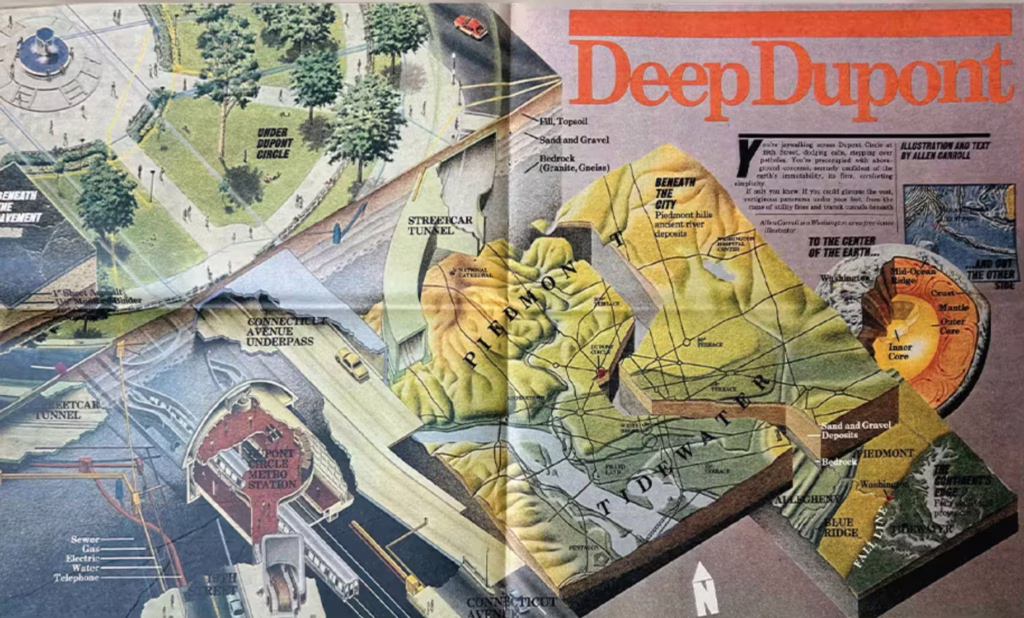
Carroll was hired to create map graphics for The Washington Post Magazine’s centerfold, including a “cutaway” showing what is beneath the city’s famous DuPont Circle — abandoned streetcar tunnels, the Metro, electrical lines, and sewers — and then expanding outward to the physiography of the region and halfway around the world to the Indian Ocean. With his growing portfolio, he landed a job at National Geographic.
Hearing his story, Clark students in the audience asked Carroll for advice on pursuing careers after graduation.
“I would much counsel you to develop your writing skills, no matter what you’re going to do. Being able to write well and express yourself well is so basic and will be so useful in every endeavor,” he said.
His second piece of advice, he added, would be to “pay attention to what you do outside the classroom. One of the best things I stumbled into is that I became editor of the student newspaper, and that was like a second major because I learned writing, editing, and design. And that was an enormous headstart toward the alumni magazine, which then helped launch me into the larger workforce.”
With his retirement on the horizon, Carroll is pondering the future of storytelling, hoping that “Story Maps can be a tool to combat a horrific pandemic of disinformation that we all have to fight. We must pick up the banner and tell the story of the Earth.”
Carroll’s talk was sponsored by the School of Climate, Environment, and Society, Department of Sustainability and Social Justice, Graduate School of Geography, Clark Center for Geospatial Analytics, and the Biology Department.
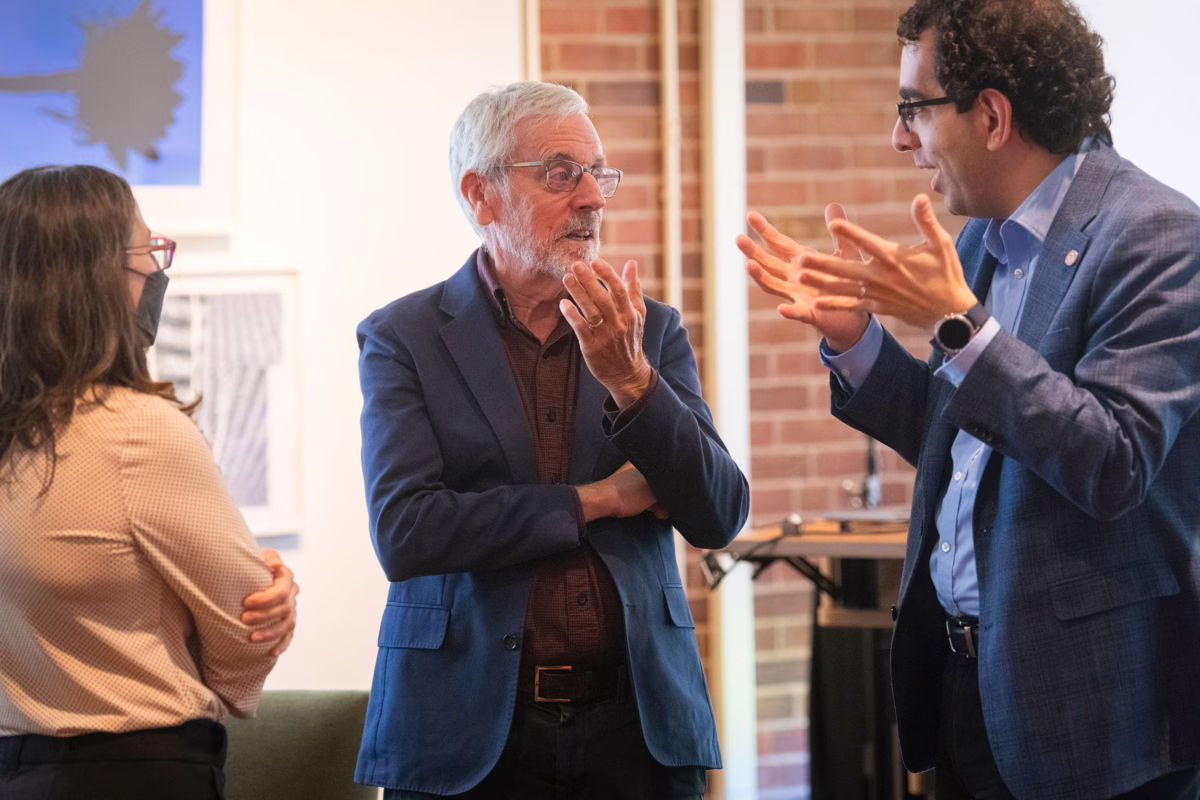
Top photo, from left, Geography Professor Florencia Sangermano, Esri Story Maps founder Allen Carroll, and Geography Professor Hamed Alemohammad, director of the Clark Center for Geospatial Analytics, discuss mapmaking. Photo by Steven King, University Photographer