Using data on photosynthesis, Clark geographer weighs in on climate change debate
An ongoing debate in the scientific community — one that GOP presidential candidate Ted Cruz and others have used to reject human-induced climate change — involves an apparent decade-long “hiatus” in global warming. In 2013, the United Nations’ Intergovernmental Panel on Climate Change noted a slowdown in global warming from 1998 to 2012. Then last July, researchers from the National Oceanographic and Atmospheric Administration (NOAA) released “newly corrected and updated global [sea] surface temperature data … [that] do not support the notion of a global warming ‘hiatus.’ ” This month in Nature Climate Change, atmospheric scientists reaffirmed that the hiatus did, indeed, occur. However, they urged, “it has been imperative for scientists to provide a timely explanation of the warming slowdown, and to place it in the context of ongoing anthropogenic warming.” In a talk titled “The Global Warming Hiatus: Evidence in the Response of Vegetation” for Clark University’s Climate Change Teach-in on March 23, J. Ronald Eastman, professor of Geography, did just that.“The question now is: What’s going on? Is [the hiatus] really there or is it not?” asked Eastman. “What we need is an independent line of evidence, because everyone is arguing over their temperature data sets, and there are questions about how the data are prepared. And so I thought: What about looking at evidence from plants? … Because we know that temperature does has a direct effect on photosynthesis.”
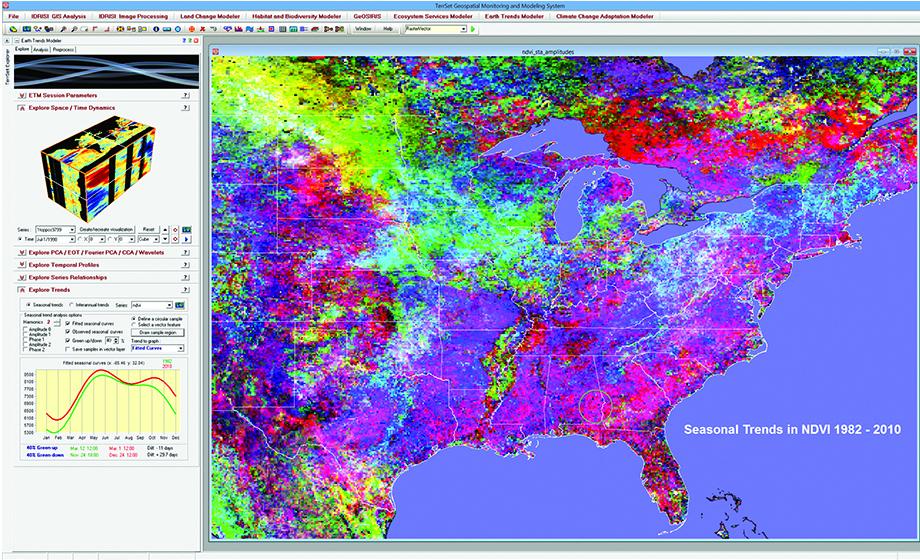
 In his research and work as Director of Clark Labs, Eastman regularly employs NASA weather satellite images and data on vegetation. The NDVI (Normalized Difference Vegetation Index)data set covers 1982 to 2014, providing a wide span of time to observe the photosynthesis — also called productivity — of plants.
By comparing this set with Berkeley Earth Surface Temperature (BEST) data gathered from the largest array of climatological stations, “you can see that the relationship between anomalies in temperature and anomalies in vegetation is actually pretty strong,” he said.
Eastman showed colorful charts and maps that incorporate the vegetation and temperature data and coalesce hundreds of satellite images; he created the images using Clark Labs’ IDRISI Geographic Information System (GIS) and Image Processing software — tools that have become popular with researchers from across the world — which he developed.
The images show that the correlation between increased global temperatures and increased photosynthesis is especially strong when incorporating month-by-month data from northern Europe. Eastman used seasonal trend analysis, a method he has used many times before to capture and assess longer-term trends.
“If we use long-term trends that remove the seasonality, it is consistent with the hiatus, but it’s not as strong,” Eastman said.
But when incorporating seasonal data, there is a clear relationship between warmer winter temperatures and increased photosynthesis in plants in springs from 1982 to 1998, he pointed out. That’s followed by images that depict decreased photosynthesis and colder winters from 1999 to 2014.
“To me, the evidence supports the concept of a pause, a hiatus, a slowdown, call it what you will,” he said. “We don’t have to argue about whose data set is better; we’ve got a second piece of evidence [the data from vegetation productivity] that corroborates the presence of a slowdown in the greater global warming; some would say even a reversal.”
But what caused the slowdown? Scientists, according to Eastman, suggest these possible causes:
In his research and work as Director of Clark Labs, Eastman regularly employs NASA weather satellite images and data on vegetation. The NDVI (Normalized Difference Vegetation Index)data set covers 1982 to 2014, providing a wide span of time to observe the photosynthesis — also called productivity — of plants.
By comparing this set with Berkeley Earth Surface Temperature (BEST) data gathered from the largest array of climatological stations, “you can see that the relationship between anomalies in temperature and anomalies in vegetation is actually pretty strong,” he said.
Eastman showed colorful charts and maps that incorporate the vegetation and temperature data and coalesce hundreds of satellite images; he created the images using Clark Labs’ IDRISI Geographic Information System (GIS) and Image Processing software — tools that have become popular with researchers from across the world — which he developed.
The images show that the correlation between increased global temperatures and increased photosynthesis is especially strong when incorporating month-by-month data from northern Europe. Eastman used seasonal trend analysis, a method he has used many times before to capture and assess longer-term trends.
“If we use long-term trends that remove the seasonality, it is consistent with the hiatus, but it’s not as strong,” Eastman said.
But when incorporating seasonal data, there is a clear relationship between warmer winter temperatures and increased photosynthesis in plants in springs from 1982 to 1998, he pointed out. That’s followed by images that depict decreased photosynthesis and colder winters from 1999 to 2014.
“To me, the evidence supports the concept of a pause, a hiatus, a slowdown, call it what you will,” he said. “We don’t have to argue about whose data set is better; we’ve got a second piece of evidence [the data from vegetation productivity] that corroborates the presence of a slowdown in the greater global warming; some would say even a reversal.”
But what caused the slowdown? Scientists, according to Eastman, suggest these possible causes:
- A solar cycle that has resulted in the sun emitting half as much energy as it did during the mid-1990s.
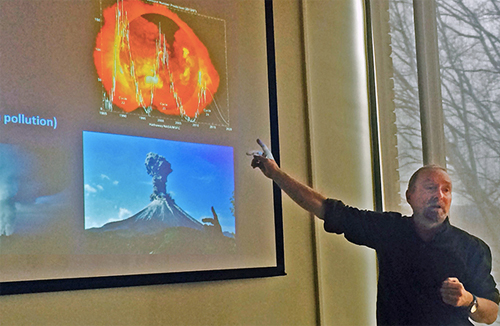
- Volcanic eruptions that spewed dust, which reflected energy back to space.
- China’s doubling of the use of coal in the 2000s. The pollution resulting from the increased burning of this fossil fuel had the same effect as volcanic dust.
- Changes in sea surface temperatures due to an exceptionally lengthy and strong La Niña effect, where stronger trade winds replaced the warm water of the central Pacific Ocean with colder water from the deep, resulting in a cooler climate. The opposite effect is El Niño, which we are experiencing now — and which has contributed to New England’s mild winter, he explained.