The Architecture of Vision: Insights from the #WallOfMaps
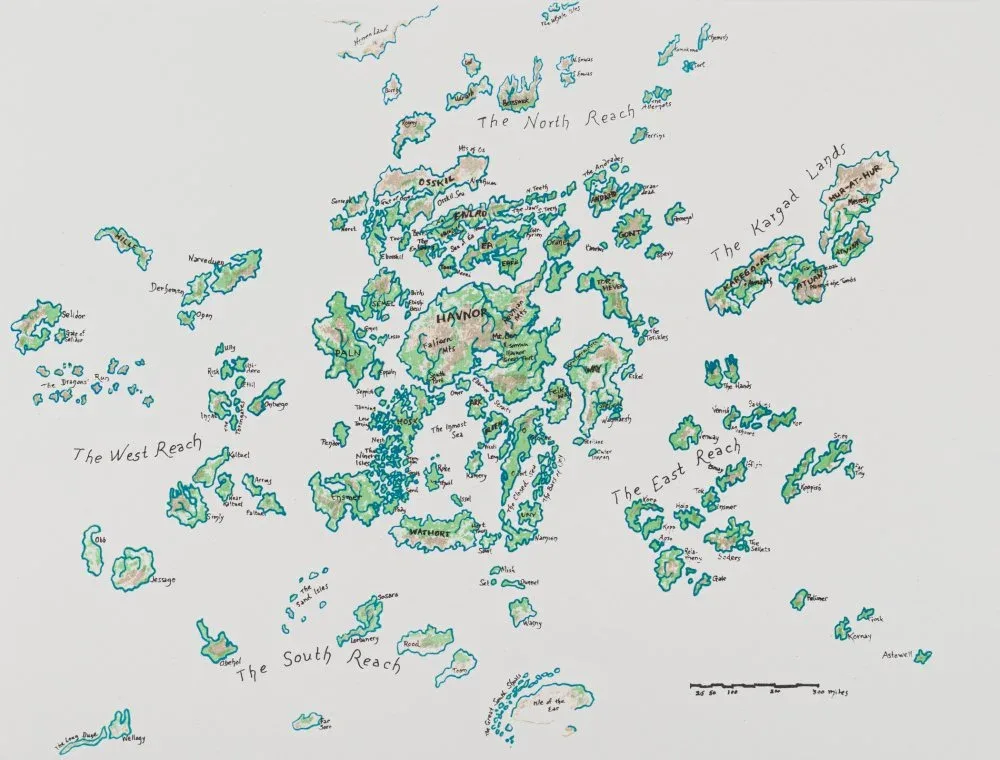
How do we make sense of systems that are too big to see? At the Clark Center for Geospatial Analytics (Clark CGA), this is the central question of our work. Through our #WallOfMaps series, we are stepping back from the code to explore how mapping serves as a bridge between where we stand and what we can imagine. Maps are often mistaken for mere data snapshots, but as Denys Godwin explains, they are actually “tools for thinking.” Because humans have an innate gift for spatial cognition, we navigate abstract concepts best when we can visualize them like physical terrain. Godwin points to Ursula K. Le Guin’s map of Earthsea as the perfect example; drawn in pencil on butcher paper, it provided the foundation for an entire world before the story even began.
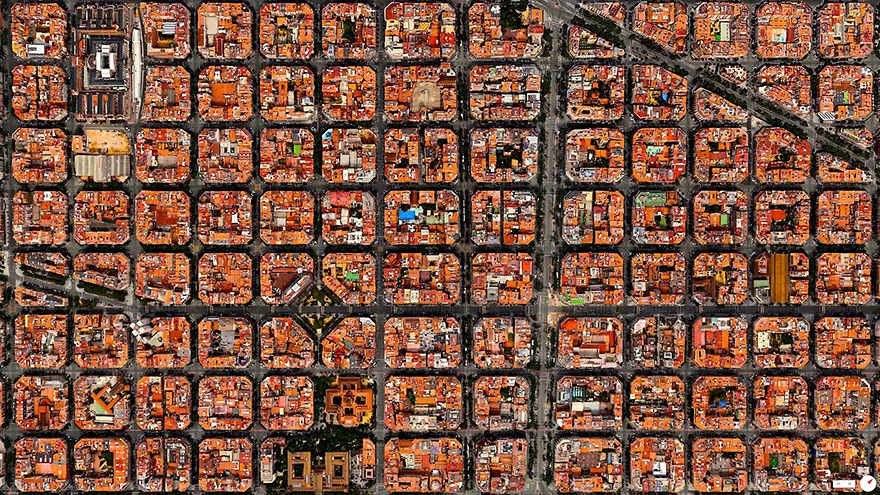
At the Clark CGA, we apply this same principle to the real world by turning complex datasets into clear, spatial visions. This is vital because, as Research Associate Eli Simonson notes, some patterns on our planet are simply too large to see from the ground. Eli suggests that “maps are cool because they enable us to understand and visualize large-scale patterns that exist on our planet,” allowing us to see features like forests and urban layouts at scales that are not physically possible from a human perspective. Whether observing the distinct patterns of deforestation in the Brazilian Amazon or the iconic grid of Barcelona, satellite imagery makes human impact visible in a way no single person could witness alone.
The history of mapping is ultimately the history of human curiosity. For hundreds of thousands of years, our ancestors viewed the world as only what existed between their toes and the horizon. IT Specialist Pete Wason describes the first map as a fundamental shift in the evolution of the human mind. “Suddenly we were birds and could see where we were in the larger context,” Wason explains. At Clark University, we use that bird’s-eye view to protect the only home we have. Whether it is a fictional archipelago or global environmental data, the right map changes how we think.