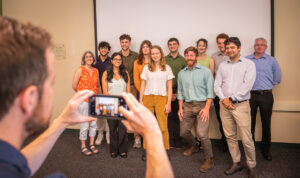
The Human-Environment Regional Observatory (HERO) program is a unique undergraduate-graduate-faculty experience that engages in research on human-environment relationships in Massachusetts. Starting in the summer, HERO Fellows conduct hands-on research under the mentorship of Clark University faculty. The program is currently sponsored by the John T. O’Connor ’78 Fund.
Why be a HERO?
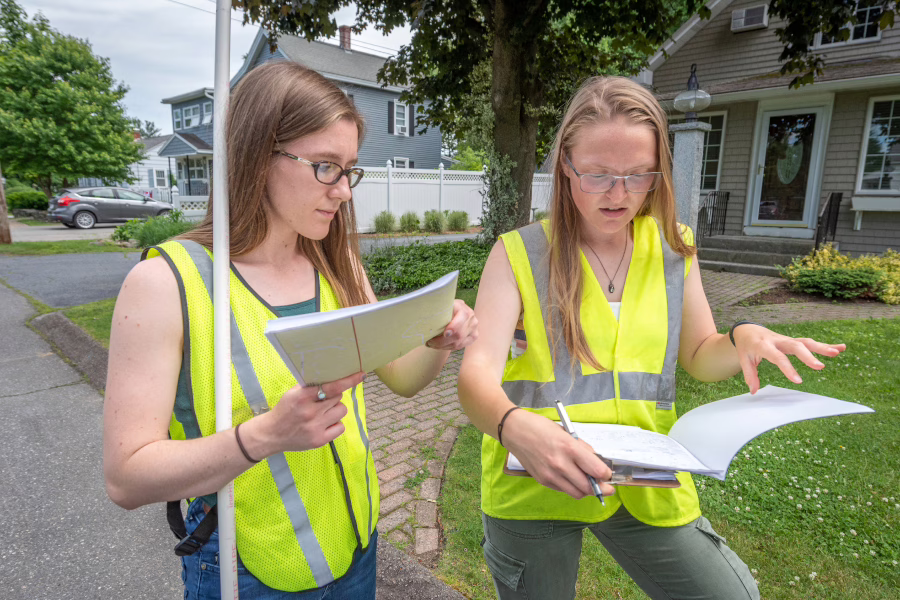
HERO Fellows analyze the causes and consequences of global environmental changes at local scales in faculty-led research projects. Each fellow is paired with a Clark faculty mentor and other researchers on the HERO team. Fellows learn how to use various research methods such as geographic information science (GIS), remote sensing, geostatistical modeling, interviews, and focus groups.
- Unique hands-on research experience working with graduate students and faculty
- Opportunities for publications, presentations, honors, and awards
- Stipend for eight weeks of research, plus academic credit in the following year
- Funding for attendance to present research at the Association of American Geographers (AAG) annual scholarly meetings
How to Apply
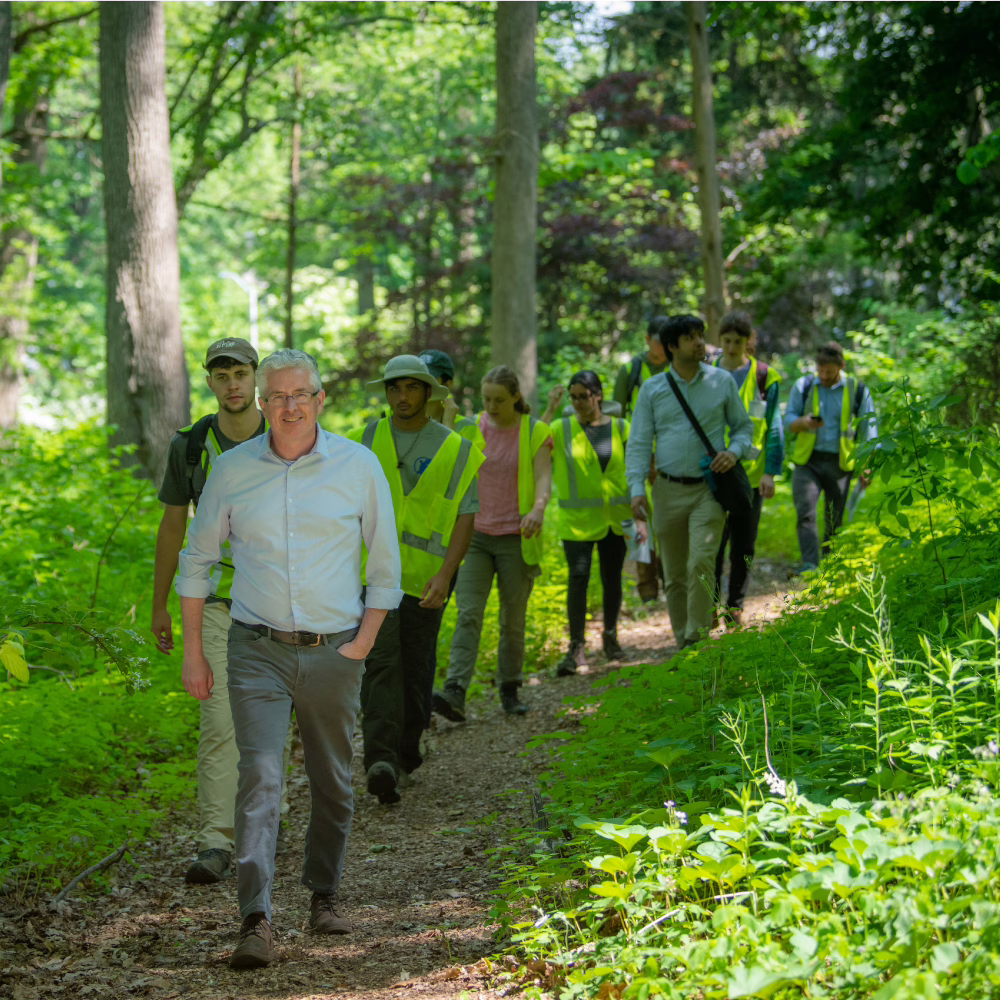
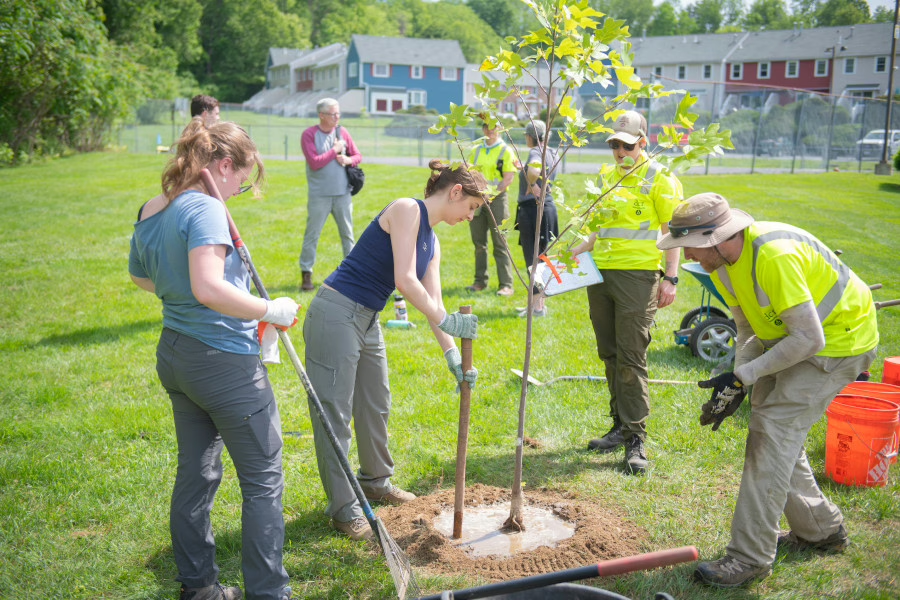
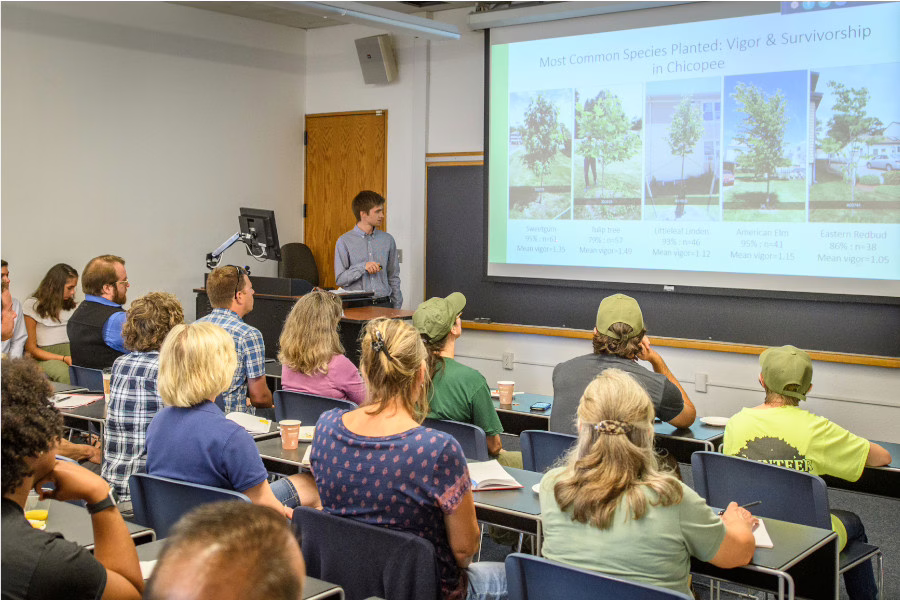
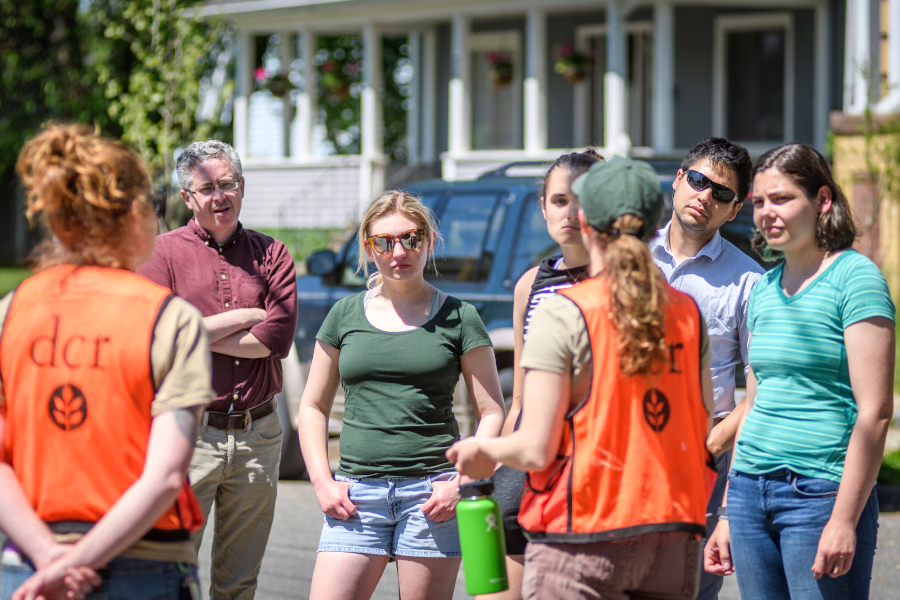
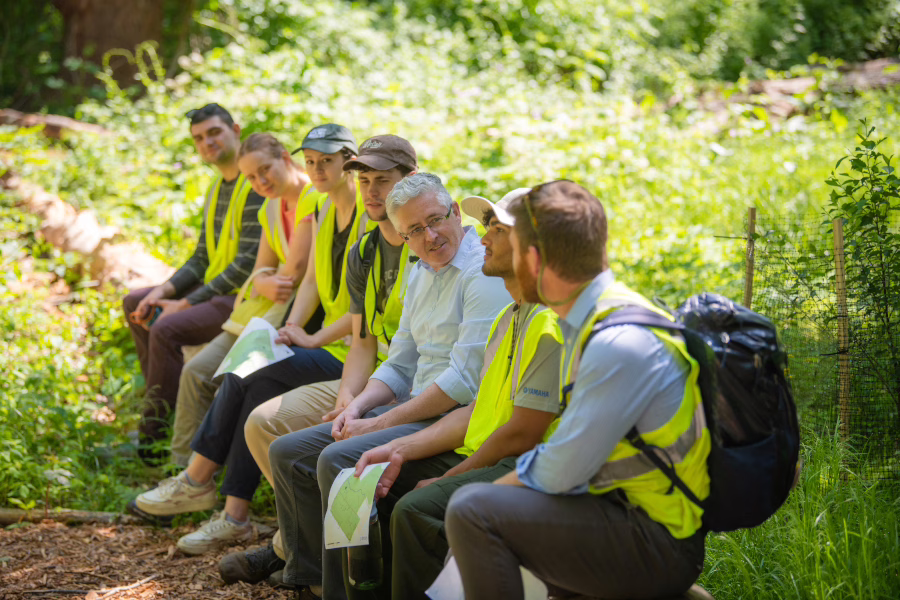
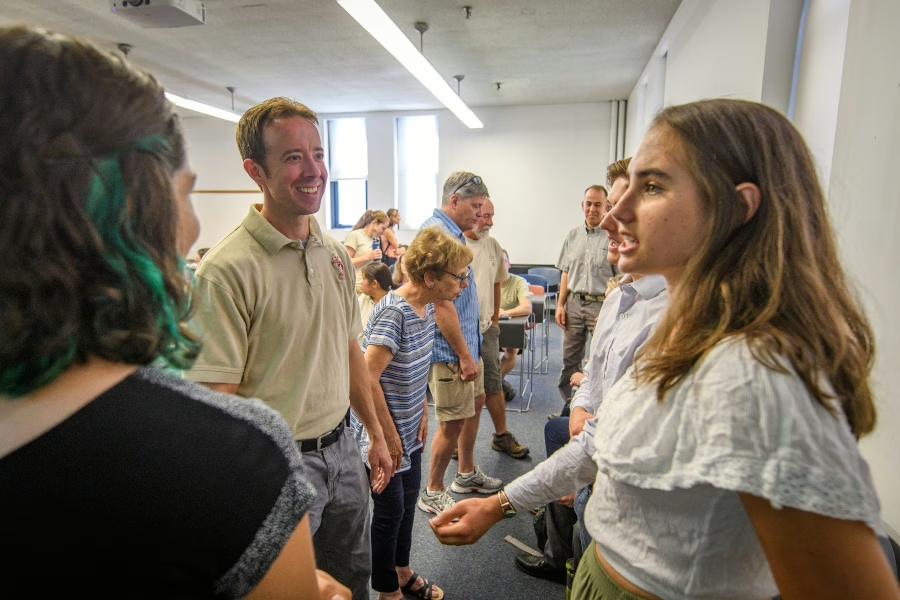
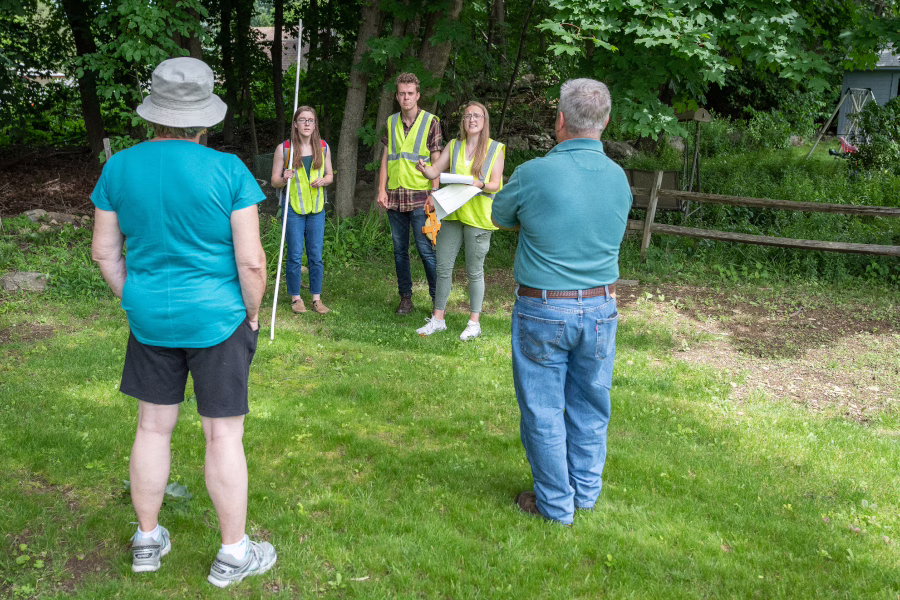
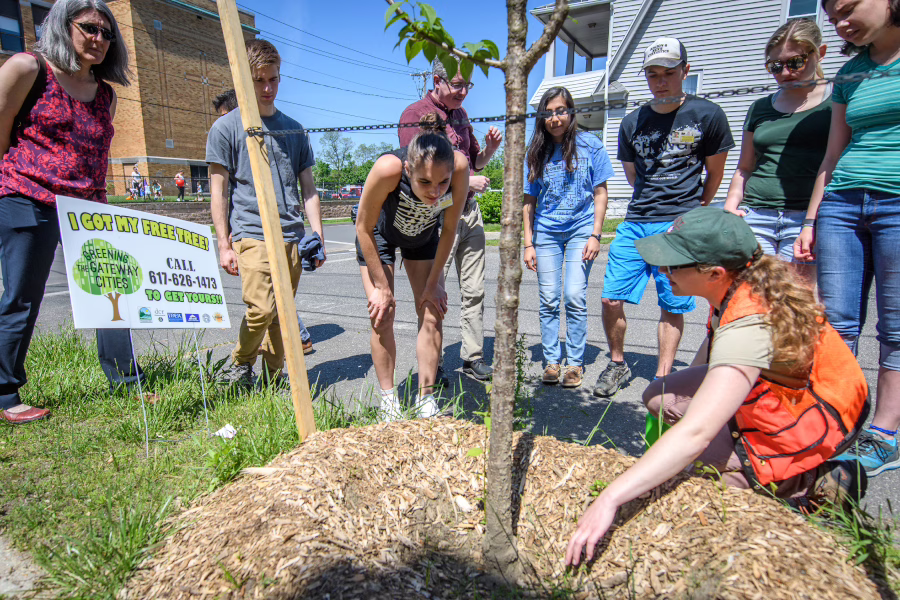
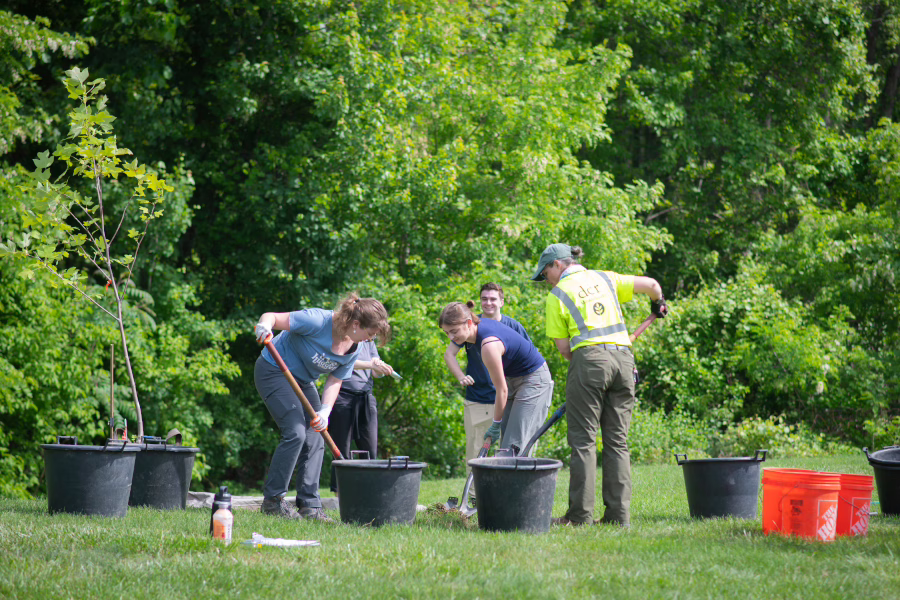
A fellowship through the HERO program gives you the opportunity to perform field work, capture real data, and present at stakeholder meetings.
Applications will be accepted until February 15.
Current and Past Research
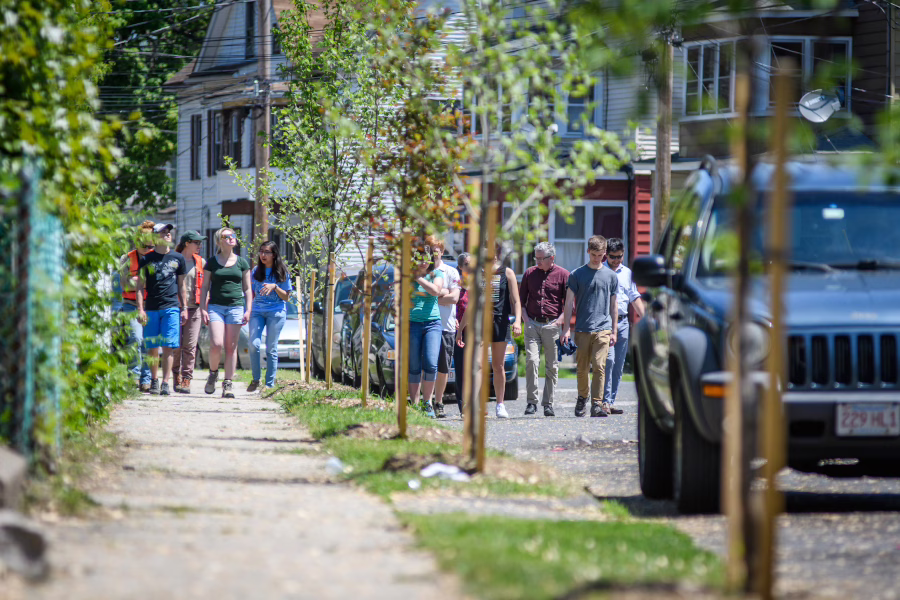
HERO fellows have researched tree replanting, dynamic land change, climate change, and other areas to explore their impact environmentally and socially.
HERO Research News

The HERO Experience
“I didn’t see a lot of other schools with a research program like this. HERO definitely helped me choose Clark, especially because of how small the program is, and how the professors work directly with you.”
Abigail Riseman ’26